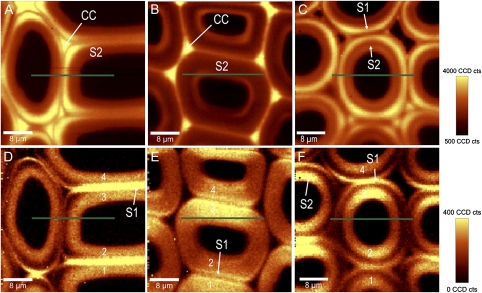
Fig. 6.
(A–F) Changes in lignin amount (integral from 1542–1696 cm−1) in normal latewood (A), opposite (B), and compression wood (C) of spruce with the laser polarization direction parallel to the x-axis (green lines). Differences in cellulose orientation are visualized by integrating from 1063–1102 cm−1 (D–F) and spectra for microfibril angle prediction extracted separately from four tangential cell wall layers (1–4).

