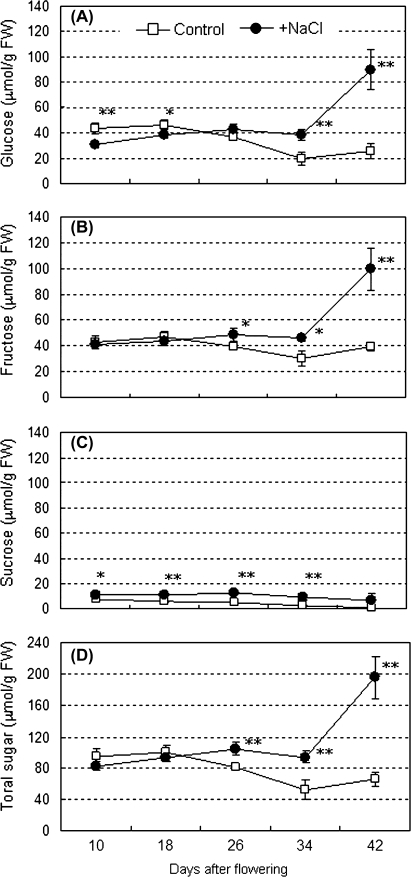
Fig. 2.
Change in soluble sugar content in developing fruits grown under control and saline conditions. (A) Glucose; (B) fructose; (C) sucrose; (D) total sugars. White squares and black circles indicate control (0 mM NaCl) and salinity treatments (160 mM NaCl), respectively. The horizontal axis indicates fruit developing stages (DAF). Values are means ±SD (n=3). The asterisks indicate statistical significance of the means in the same developing stage estimated using Fisher's PLSD test (*P <0.05, **P <0.01).

