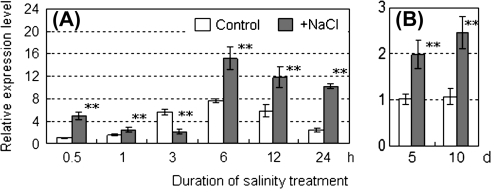
Fig. 5.
Relative expression levels of LeSUT1 genes in leaves of plants grown under control and saline conditions for short (A) and long (B) periods. (A) Leaves were sampled at 0.5, 1, 3, 6, 12, and 24 h after the start of exposure to salinity stress. (B) Leaves were sampled 5 d and 10 d after the start of exposure to salinity stress. Open and shaded columns indicate control (0 mM NaCl) and salinity treatments (160 mM NaCl), respectively. Values are means ±SE (n=4). The asterisks indicate statistical significance of the means estimated using Fisher's PLSD test (*P <0.05, **P <0.01).

