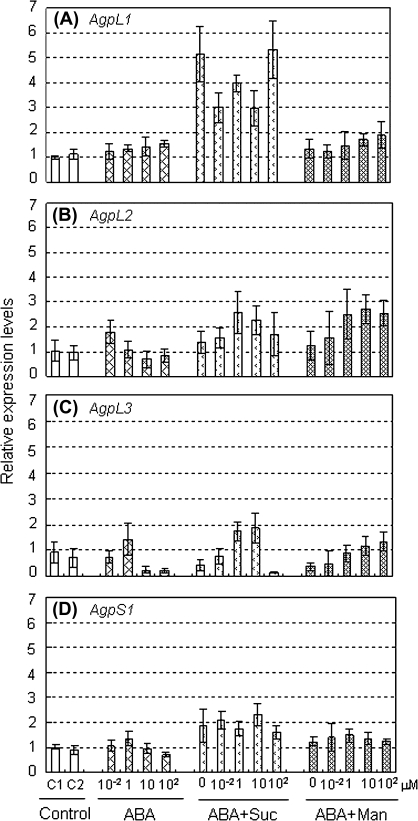
Fig. 8.
Relative expression levels of AGPase genes in fruit treated with ABA, sucrose, and mannitol as single or multiple effector(s). (A) AgpL1, (B) AgpL2, (C) AgpL3, (D) AgpS1. Fruits at 10 DAF of plants grown in control condition were cut in half and incubated for 6 h on half-strength MS medium plate containing the indicated effector(s). Suc, 150 mM sucrose; Man, 150 mM mannitol; C1 (control 1), 1% agar; C2 (control 2), the half-strength MS plate without effectors. The ABA concentrations were indicated under the each column. Values are means ±SE (n=4).

