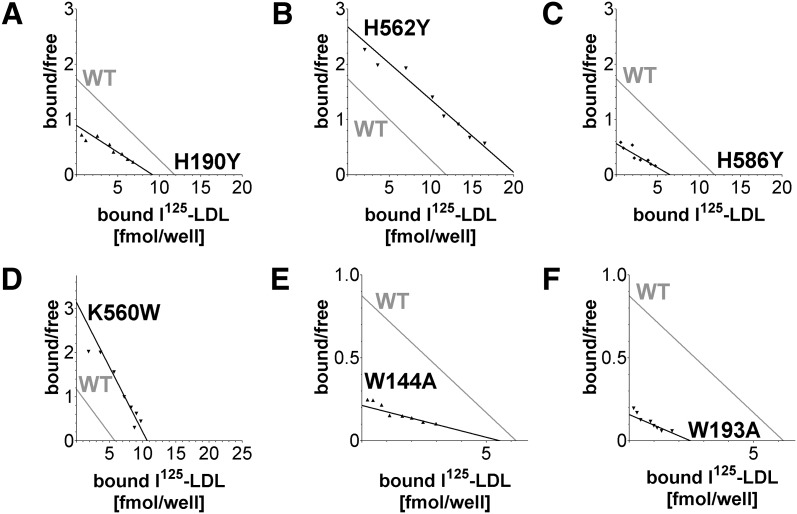
Fig. 4.
Scatchard plot analysis of selected binding data from Fig. 3. Each Scatchard plot visualizes a mutant (in black) as well as superimposed WT (in gray) permitting visual assessment of LDL affinity loss (decreased slope) or LDL affinity gain (increased slope) compared with WT. The slopes were calculated using nonlinear regression of the specific binding curves using a one-binding site model. Bound/free is defined as bound I125-LDL [(fmol/well)/free I125-LDL [nM]. A: H190Y; B: H562Y; C: H586Y; D: K560W; E: W144A; and F: W193A. For data and Scatchard plot analysis of all 12 mutants and their accompanying WT controls, see supplementary Fig. II.

