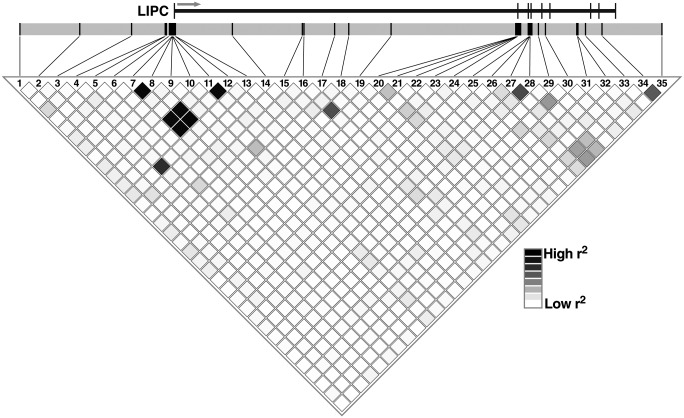
Fig. 1.
Linkage disequilibrium (r2) plot from Haploview for 35 LIPC SNPs in Turks. Darker diamonds represent regions of high pairwise r2; lighter diamonds represent regions of low pairwise r2. The exons on LIPC are shown as tick marks in scale. The arrow indicates the direction of expression of LIPC.

