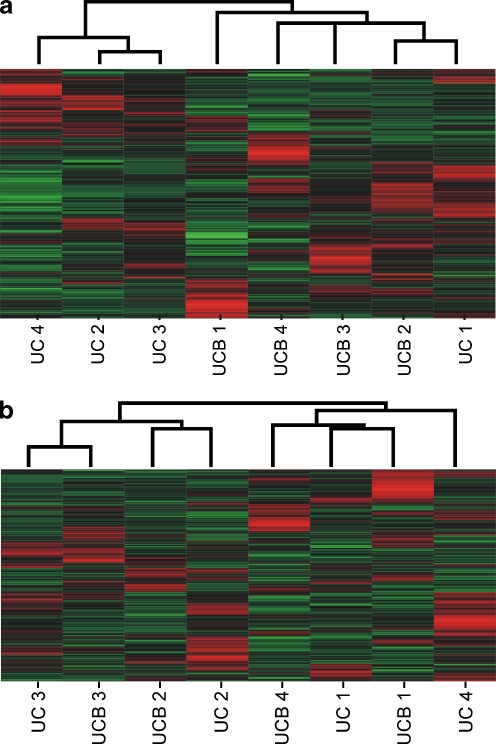
Fig. 2.
Non-supervised hierarchical clustering of a all 10,935 protein-coding genes and b all 7,170 intronic noncoding RNAs, expressed in MSC from UC and UCB. Each row represents the relative levels of expression for a single gene, calculated as the number of standard deviations above (red) or below (green) the mean expression level of that gene across the samples. Each column represents the average expression of two technical replicate (Cy3 and Cy5) measurements of each sample. In a MSC isolated from the same tissue clustered together while MSC from different tissues (UC or UCB) and same donors are found in different clusters. In b MSC isolated from different tissues (UC or UCB) and the same donor clustered together while MSC from the same tissue and different donors are found in different clusters

