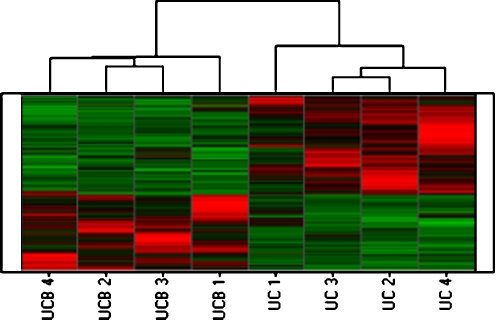
Fig. 3.
Expression signature of protein-coding transcripts in MSC from UC and UCB. A total of 1,870 genes with significantly different levels among MSC from UC and UCB samples were identified by SAM one-class statistical analysis (FDR < 5%) and hierarchically clustered as described in Materials and Methods. Each row represents the relative levels of expression for a single gene, calculated as the number of standard deviations above (red) or below (green) the average expression level of that gene across the samples. Each column represents the average expression of two technical replicate (Cy3 and Cy5) measurements of each sample

