Fig. 1.
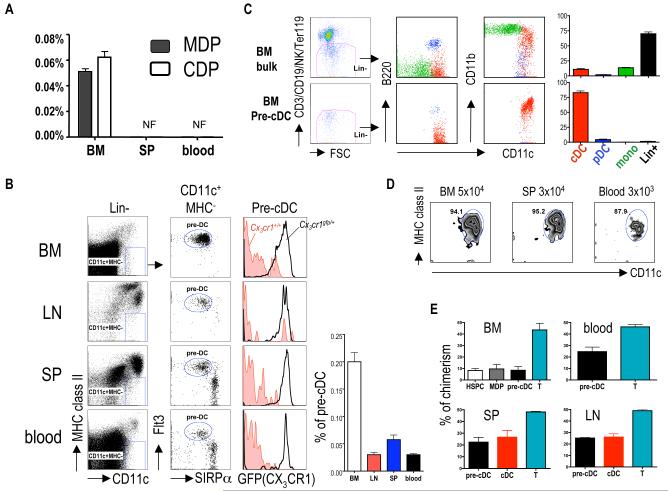
Isolation of pre-cDCs. (A) Presence of MDPs and CDPs in the bone marrow (BM), blood or spleen (SP); not found (NF). (B) Identification of pre-cDCs in bone marrow, LNs, spleen and blood. Bar graph shows the percentage of pre-cDC in each organ. 1×10⁶ cells were acquired per sample. Lin: CD3/CD19/Ter119/NK1.1/B220. (C) Donor-derived spleen cells (CD45.2+) were analyzed for cDC (CD11c+ MHC class II+), pDC (CD11cint B220+) and monocytes (CD11b+ CD11clo/−) 7 days after intravenous injection of 2×10⁶ bone marrow cells or 1×10⁵ pre-cDCs. (D) Analysis of donor-derived splenocytes after transfer with the indicated number of pre-cDCs from bone marrow, spleen and blood. (E) Chimerism in parabiotic mice. In (B) and (C) left side shows representative dot plots. Bar graphs summarize 2-4 independent experiments with 3-4 mice each. Error bars represent the mean ± SEM.

