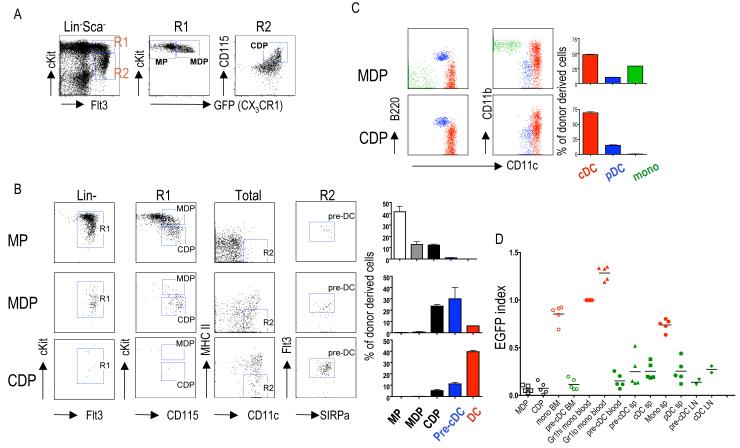
Fig. 2.
Progenitor-product relationship among MDP, CDP and pre-cDC. (A) Phenotype of myeloid progenitor (MP, Lin− Sca-1− c-Kithigh CX3CR1−), MDP (CX3CR1+ c-Kithi) and CDP (CD115+CX3CR1+c-Kitlo) in Cx3cr1gfp/+ mice. (B) Donor-derived bone marrow cells analyzed by flow cytometry for presence of MDPs, CDPs and pre-cDCs two days after intra-bone marrow transfer of 5×10⁴ MPs, MDPs or CDPs. (C) Donor-derived splenocytes analyzed for the presence of cDCs, pDCs and monocytes 7 days after transfer of MDPs or CDPs. (D) EGFP expression in indicated cell populations in LysM-Cre x Rosa26-StopfloxEGFP reporter mice (fig. S8). EGFP index = % of EGFP+ cells / % of EGFP+ Gr1high blood monocytes (20). In (C) and (D) left side shows representative dot plots. Bar graphs summarize 2-4 independent experiments with 3-4 mice. Error bars represent the mean ± SEM.

