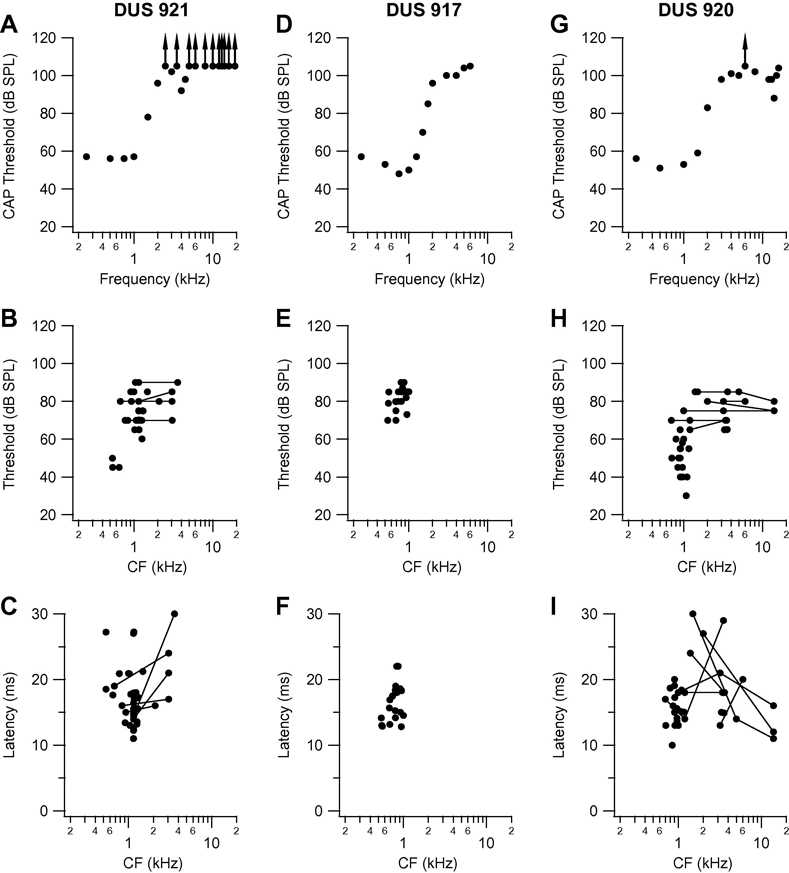
Fig. 2.
Compound action potential audiogram and variation in threshold, and minimum latency at characteristic frequency (CF) as a function of CF for the three other DUS cats: 921 (A, B, C). 917 (D, E, F) and 920 (G, H, I). Points joined by lines in threshold and latency plots are those for clusters that had dual CF at the frequencies joined by the lines. Other conventions as in analogous panels in Fig. 1.

