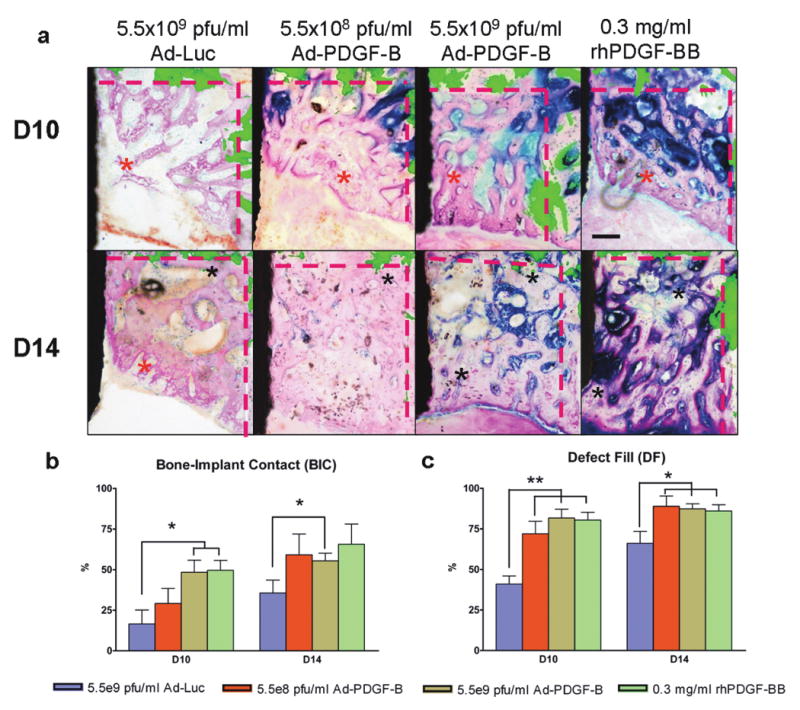
Figure 2. Histologic view of each group for 10 days and 14 days (a) and 2-D evaluations; bone-to-implant contact (BIC) (b), defect fill (c).

(a) Histologic images were overlapped by fluorescent images made by calcein injection 3 days after surgery. The fluorescence indicates the original defect boundaries. The results of Ad-Luc defects shows sparse bone formation at day 10 and a lesser degree of bone maturation at 10 and 14 days. All the PDGF-related specimens showed increased new bone formation at 10 and 14 days compared to Ad-Luc group. Scale bar in top right panel represents 200 μm. (Original magnification: ×40). (b) In BIC analysis, 5.5×10⁹ pfu/ml Ad-PDGF-B and rhPDGF-BB groups showed significantly higher ratio than the control group at 10 days and 5.5×10⁹ pfu/ml Ad-PDGF-B showed significantly higher ratio than control group at 14 days. (c) In defect fill analysis, all three PDGF treatment groups showed higher fractions than Ad-Luc treated defects at 10 and 14 days. Black area in left side: dental implant, black asterisks; matured new bone, red asterisks; young new bone, and dashed line; borders of the osseous defect. Data are presented as mean and bars indicate standard error measurement (n=6-8).* p<0.05, ** p<0.01, Abbreviations: BIC: bone to implant contact.
