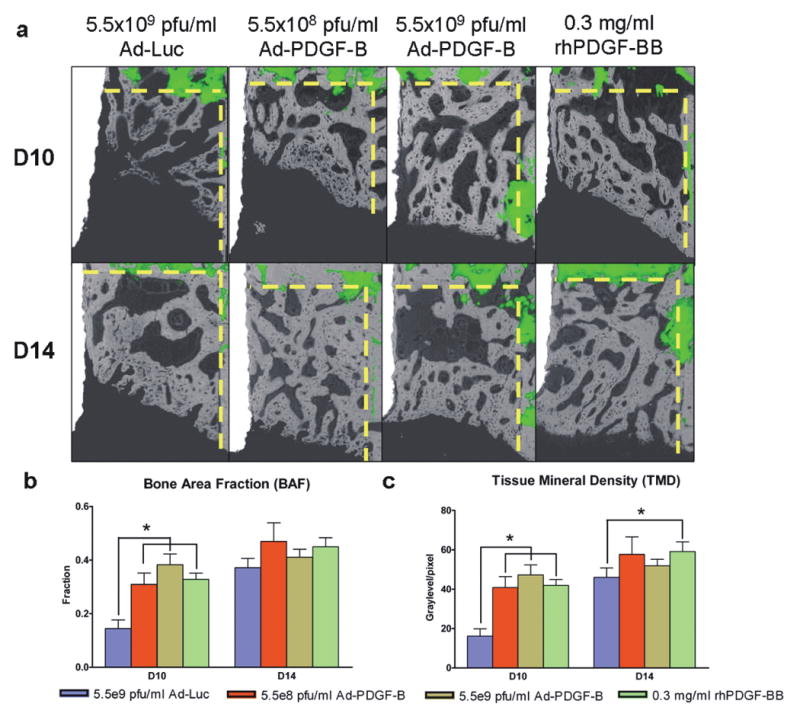
Figure 3. Back scattered SEM (BS-SEM) images (a) and 2-D evaluations; bone area fraction (b), and tissue mineral density (c).

(a) BS-SEM images were merged with fluorescent images (dashed line; borders of the osseous defect.). The BS-SEM images show mineralized tissue against the oral implant surface. (Original magnification: ×42) (b) The three PDGF treatment groups showed a significant difference in bone area fraction at 10 days compared to the control group. (c) The three PDGF groups also showed significant differences in tissue mineral density at 10 days and the rhPDGF-BB group showed significance at 14 days compared to Ad-Luc defects. Data are presented as mean and bars indicate standard error measurement (n=6-8). * p<0.05.
