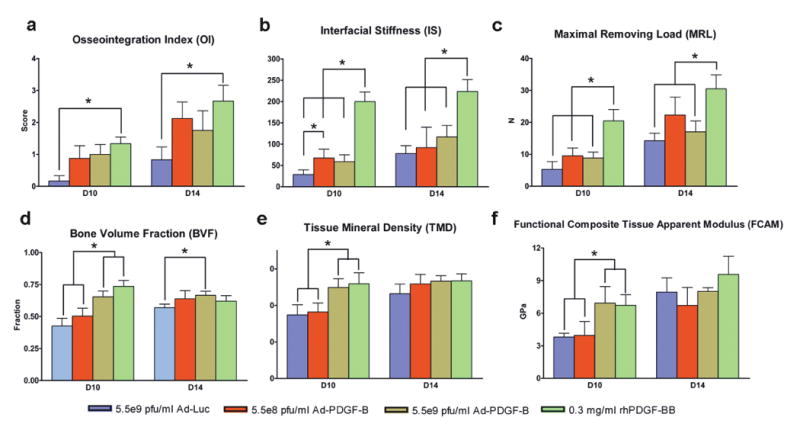
Figure 4. Biomechanical and microCT/functional stimulations demonstrate that Ad-PDGFB and PDGF-BB improve osseointegration in vivo.

Osseointegration index (a), Interfacial stiffness (b), maximum removing load (c), showed significant differences between rhPDGF-BB treatment and the other three groups. Bone volume fractions (d), tissue mineral density (e), and functional tissue modulus (f) demonstrate that 5.5×10⁹ pfu/ml Ad-PDGF-B and rhPDGF-BB displayed significant differences compared to 5.5×10⁸ pfu/ml AD-PDGF-B and Ad-Luc groups. There were no significant differences in tissue mineral density and functional composite tissue apparent modulus at day 14. Data are presented as mean and bars indicate standard error measurement (n=6-8). * p<0.05, Abbreviations: FCAM: functional composite tissue apparent modulus.
