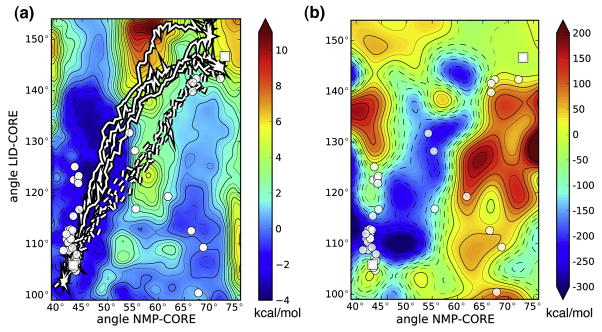
Figure 4. Angle-projected energy landscapes of apo-AdK.
A: The free energy surface  (θNMP, θLID) is shown as a function of the NMP–CORE angle θNMP and the LID–CORE angle θLID. The closed state structure 1AKE is taken as the reference with
  (1AKE) = 0. A few typical DIMS transition paths are also shown (closed→open; - - - open→closed). Crystal structures are drawn in the same positions as in Figure 3. Errors as estimated from the standard deviation of a block average are typically smaller than 1 kcal/mol. B: Potential energy landscape ΔE(θNMP, θLID) = E(θNMP, θLID) −E(1AKE). The closed state is taken as the reference so that ΔE(1AKE) = 0. The average energy of a conformation, E(θNMP, θLID), in bins of size Δθ = 5° is calculated from the umbrella sampling simulations as the statistical mechanical average of the potential energy less the umbrella biasing contribution,
. The standard deviation on ΔE is typically on the order of 200 kcal/mol (not shown).

