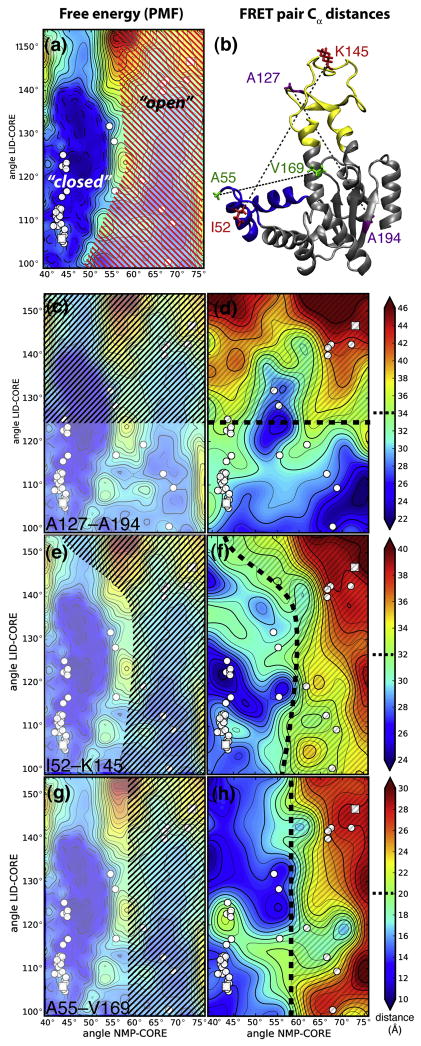
Figure 5. Thermodynamic states and qualitative interpretation of three experimental FRET distances.
A: Statistical mechanical definition of “open” and “closed” states based on the free energy surface (PMF). The PMF is repeated from Figure 4A and shown in lighter colors in the background. The free energy minimum around the closed structures is separated from the shallow minimum around the open structures (red hatched region) by a free energy barrier. The barrier splits the configuration space into two states that are conventionally labelled “closed” and “open”. The left column shows the region of the free energy surface that roughly corresponds to a population of FRET distances commonly associated with an “open state” of AdK (black hatched). B: Distances used in experimental studies shown on the open AdK structure. Purple: A127–A194 (LID–CORE)8. Red: I52–K145 (NMP–LID), corresponding to Y52–K145 in A. aeolicus23. Green: A55–V169 (NMP-LID/CORE)4. Experimental FRET distances (right column) are approximated by residue Cα–Cα distances d and projected onto domain angle space. Assuming that two populations are observed in a FRET experiment, one at shorter distances (and commonly identified with the “closed state”) and one at longer distances (“open state”), separated by a boundary (heavy broken black line), the black hatched regions schematically indicate the domain angles corresponding to these populations. See text for details. C, D: FRET pairs A127–A194. E, F: I52–K145. G, H: A55–V169.

