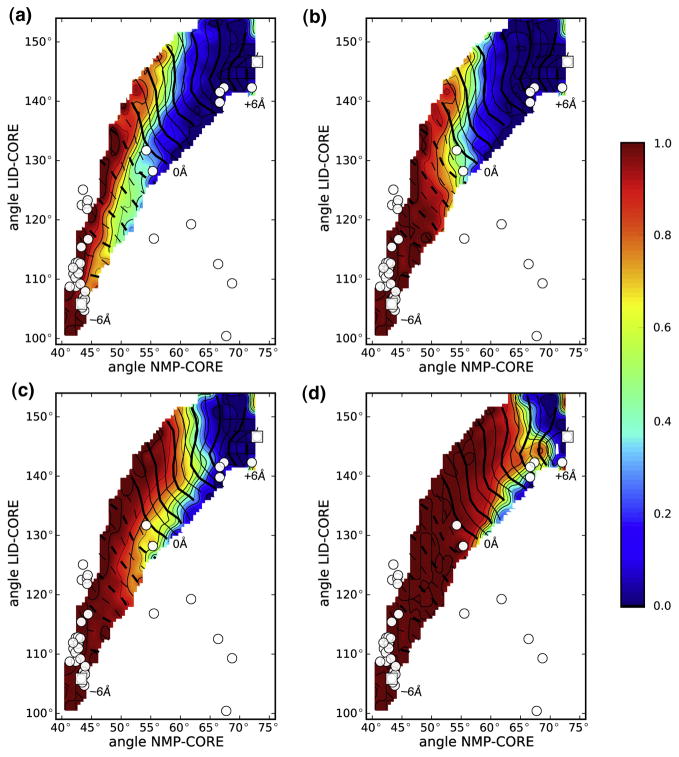
Figure 8. Salt bridge existence probability projected on NMP and LID angles.
A: D33-R156; B: R36-D158; C: D54-K157; D: K57-E170. Data are shown for the closed→open DIMS transition. The contour lines for the Δρ coordinate are shown as white lines ranging from −6 Å (broken lines Δρ < 0) to +6 Å (solid lines Δρ ≥ 0).

