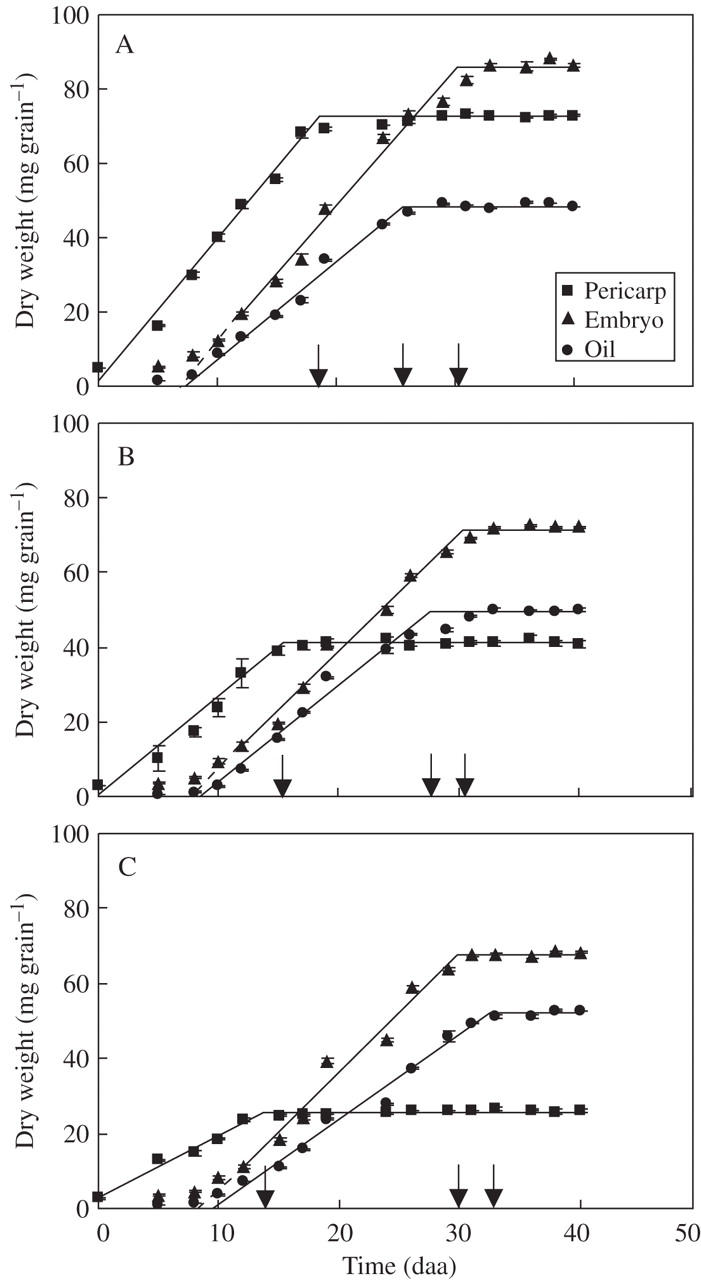
Fig. 4.

Dynamics of pericarp, embryo and oil weights per achene for three sunflower cultivars ‘Dakar’ (A), ‘11051’ (B) and ‘Prosol 35’ (C). Each point represents the mean of three replicates, vertical bars are ± 1 s.e. The continuous lines show the adjusted bi-linear functions (r2 range 0·89–0·99) and the dashed lines show the extrapolations used to estimate the start of the effective filling. The arrows indicate the end of the oil growth periods for the three achene components. Mean values for timing of initiation and rates and durations of growth for each achene component are given in Table 2–Table 4.
