Fig. 2.

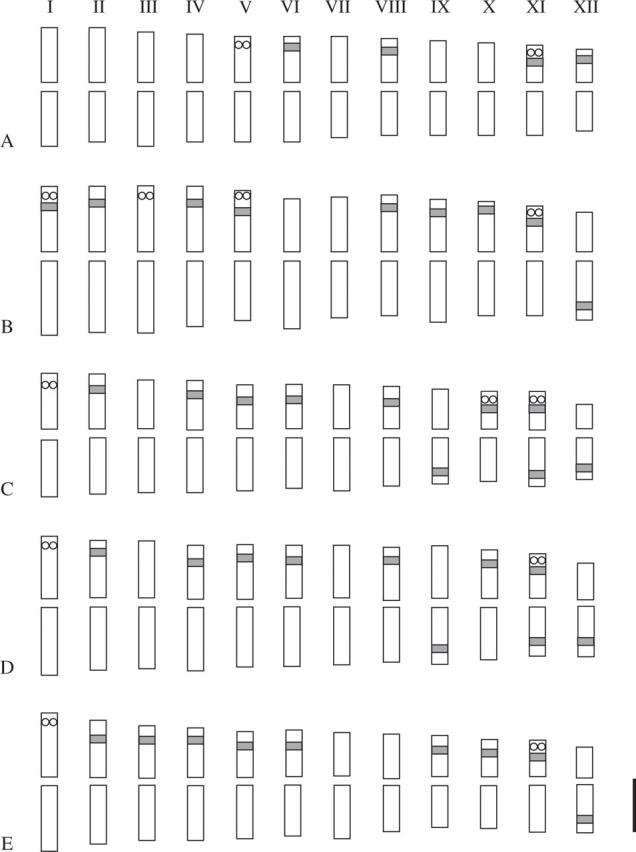
Ideogram of (A) P. bungeana, (B) P. koraiensis, (C) P. armandii, (D) P. wallichiana and (E) P. strobus karyotypes. The open dots represent signals of 5S rDNA and the solid bands represent strong 18S rDNA signals. Scale bar = 10 μm.

Ideogram of (A) P. bungeana, (B) P. koraiensis, (C) P. armandii, (D) P. wallichiana and (E) P. strobus karyotypes. The open dots represent signals of 5S rDNA and the solid bands represent strong 18S rDNA signals. Scale bar = 10 μm.