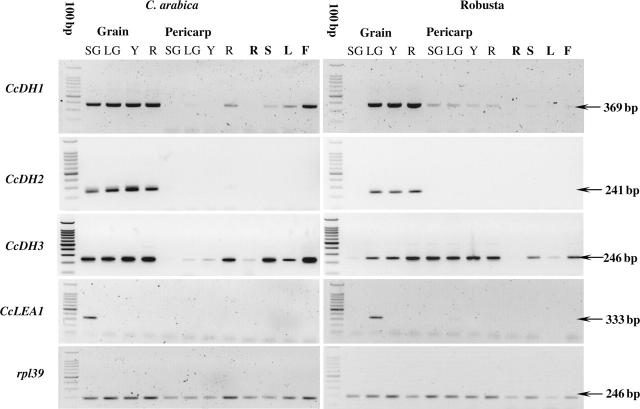
Fig. 4.
RT–PCR expression analysis of the coffee dehydrins and CcLEA1 transcripts in different organs of Coffea arabica and C. canephora. 100 bp, 100-bp molecular weight marker ladder; SG, LG, Y, R, small green, large green, yellow and red for the grain and pericarp, respectively; R, S, L, F, root, stems, young leaves and flowers, respectively.

