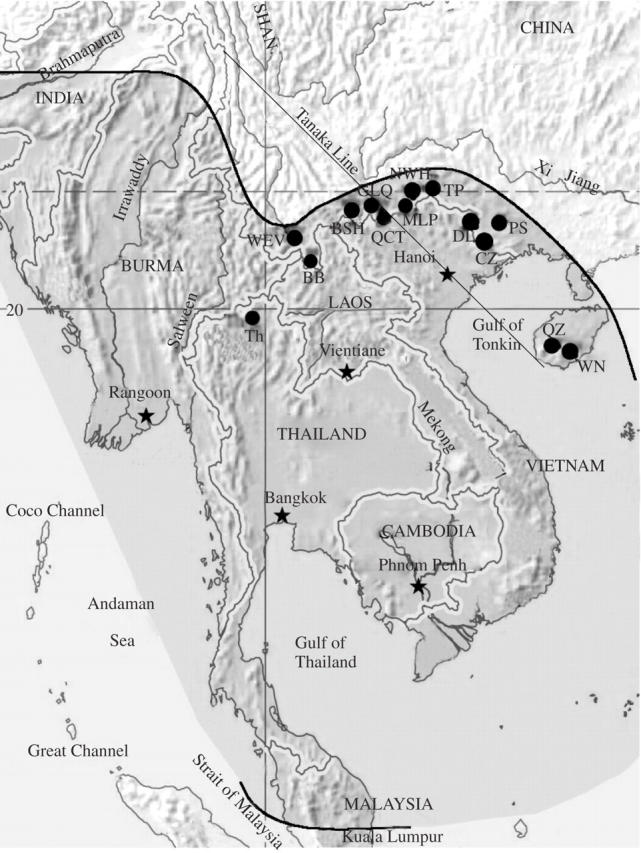
Fig. 1.

A map of the known distribution of Tacca chantrieri (shaded area between two thick black lines) and locations of sampled populations with the abbreviations used in this study (see Table 1 for explanations of population abbreviations). This map was based on data from Drenth (1972).
