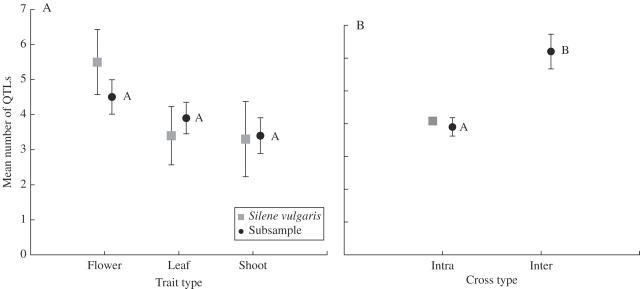
Fig. 2.
Comparison of the mean number of QTL of the subsample (see Materials and Methods) and the results reported for Silene vulgaris. Numbers are presented for intraspecific morphological trait types (A) and type of cross (B) separately. Different letters beside mean values indicate significant difference of traits calculated for the subsample (Tukey–Kramer HSD test, P < 0·05).

