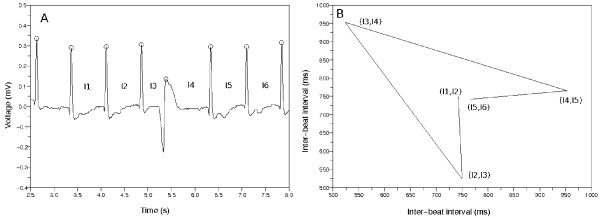
Figure 3.
The example of building a Poincaré plot. (a) Sample ECG data. There is a premature ventricular contraction (PVC). The mark O means the detector catched the QRS complex. (b) Poincaré plot made from the inter-beat intervals {I1, I2, I3, I4, I5, I6}. We drew the lines between the consecutive points in this plot. The points make a wedge-shaped diagram because of the PVC.

