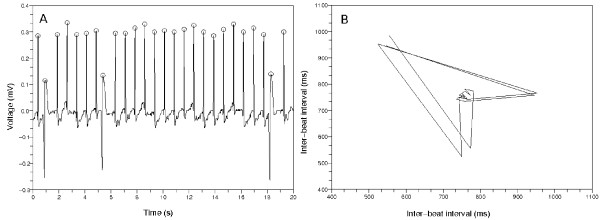
Figure 5.
Second typical Poincaré plot from a non-AFib ECG data. (a) The 20 second amount of ECG data from 'n04', CinC 2001. There are PVCs. The inter-beat intervals change around the PVCs. (b) The points of this Poincaré plot revolve clockwise and make a wedge-shaped diagram. This is because the inter-beat intervals changed around the PVCs.

