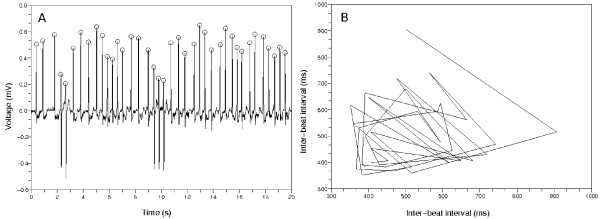
Figure 6.
Poincaré plot from an AFib ECG data. (a) The 20 second amount of ECG data. The inter-beat intervals are irregularly distributed. The mark O means the QRS detector found the time position of the ventricular activity. (b) Their corresponding Poincaré plot. There is no pattern. The points in this plot often move across the diagonal line.

