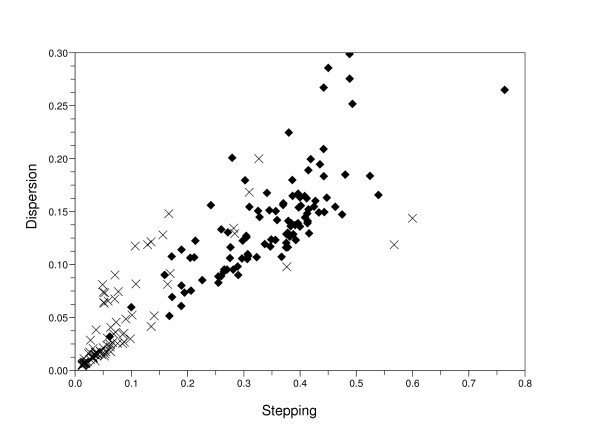
Figure 9.
A relation between two features, mean stepping increment of inter-beat intervals and dispersion of the points in Poincaré plot when we got one or too many number of clusters. We used support vector machine method on the data whose number of clusters is one or too many to discriminate AFib from non-AFib. The mark X means non-AFib data and the diamond mark means AFib data.

