Figure 3.

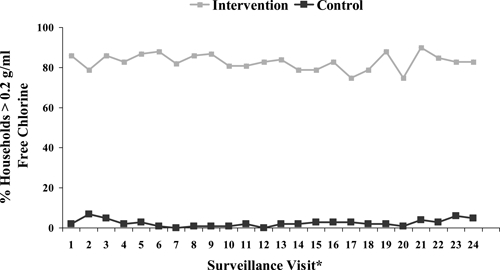
Percent of intervention and control households with ≥ 0.2 g/mL of free chlorine in stored water, by surveillance visit (N = 240). * Data was not obtained for surveillance visit number 25 due to constraints in the field.

Percent of intervention and control households with ≥ 0.2 g/mL of free chlorine in stored water, by surveillance visit (N = 240). * Data was not obtained for surveillance visit number 25 due to constraints in the field.