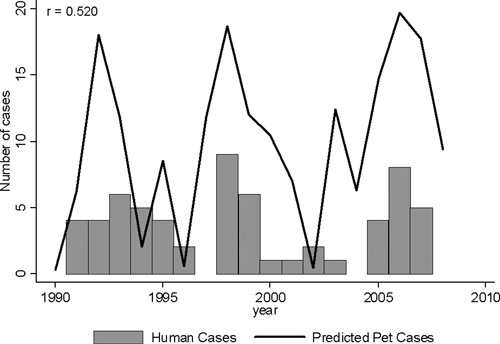
Figure 4.

Predicted pet and the actual human plague cases since 1991. The bars represent the total number of human plague cases reported from New Mexico to the CDC (1991 through 2007). The line represents the model's predicted number of pet cases. We limited the data to post 1990 for this comparison to capture the increased surveillance that was significant in the model. The correlation between predicted pet cases and human cases is 0.520 (P = 0.032).
