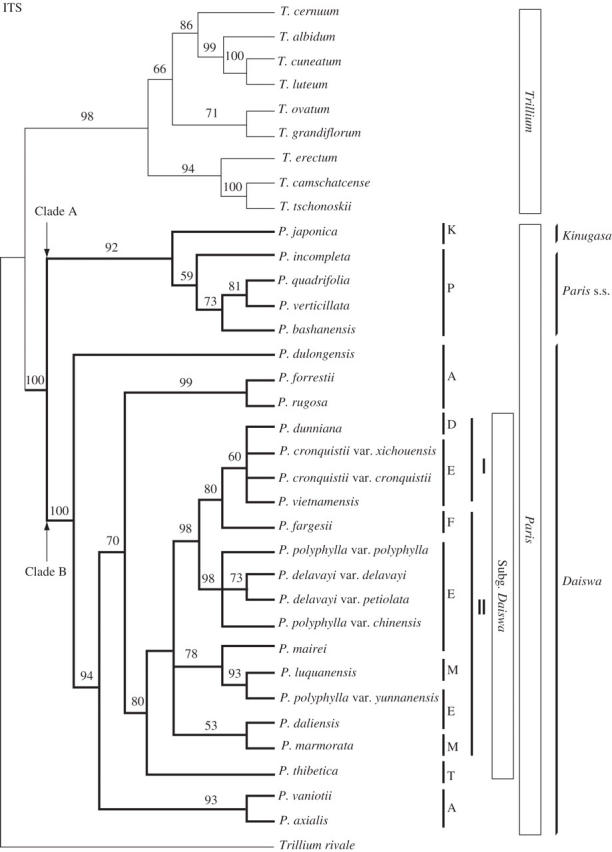
Fig. 4.

The strict consensus tree of 132 trees from parsimony analysis of ITS sequences of Paris and Trillium (length = 270, CI = 0·62, RI = 0·81). Bootstrap percentages >50 % are shown above branches. Two contrasting views of generic delimitation (see text) and the subgenera and sections of Li (1998) are indicated on the right. Abbreviations are as in Fig. 2.
