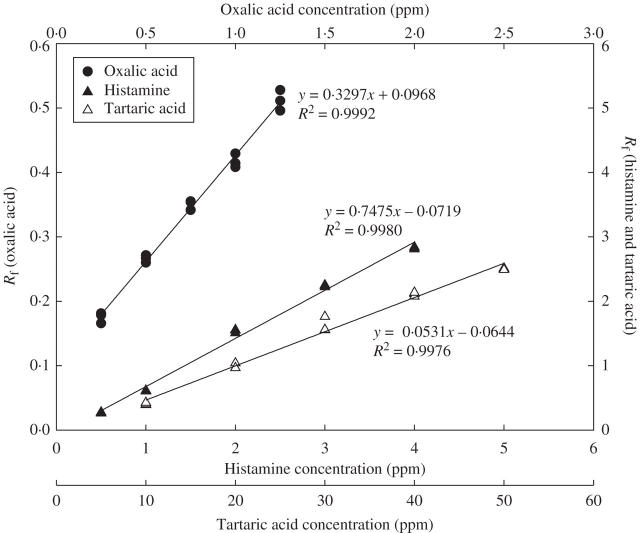
Fig. 5.
HPLC calibration curves of histamine, oxalic acid and tartaric acid. Five concentrations of each chemical were prepared in deionized water, and 20 μL of each sample was injected into a 250 × 4·6 mm C-18 column for chromatographic separation. Serotonin in deionized water was used as an internal standard, and each sample was triple-duplicated. The Rf values were estimated by the peak area of the standard divided into that of serotonin. Regression analysis from all above curves showed that coefficients of x are statistically significant (t-test, P < 0·001).

