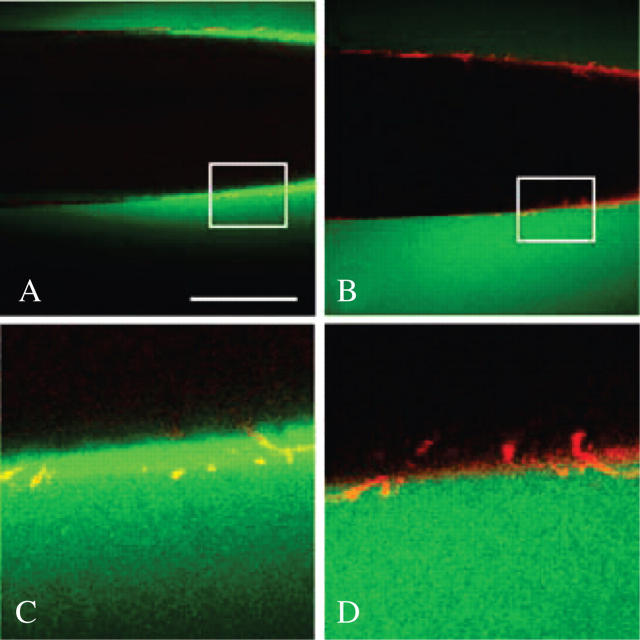
Fig. 1.
Small molecule movement through isolated cell walls of Chara. (A) FITC solution (green) has been pushed into isolated wall by mineral oil (black in lumen) and pressurized at 0.5 MPa for about 15 s. Some FITC is inside but is moving through the red-stained wall to unstirred culture medium outside. Scale bar = 0.5 mm. (B) Same wall after 3 min. Most FITC is outside. Red wall is now clearly visible. (C) Enlarged view of boxed area in (A). Note uniform passage of FITC through wall and absence of cytoplasmic organelles. (D) Enlarged view of box in (B). Detail of inner wall face is visible. Walls were stained with Congo Red.

