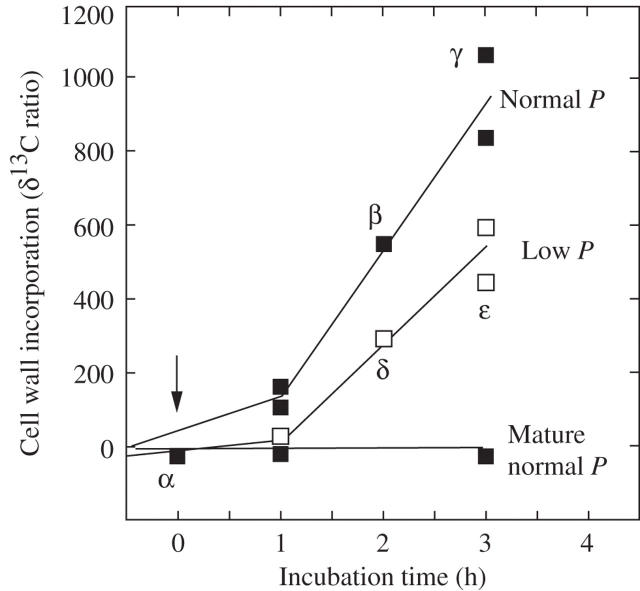
Fig. 3.
Wall deposition in growing cells at normal P (closed squares, about 0.5 MPa) and low P (open squares, 0.10 MPa below normal P). Wall deposition for mature cells is also shown. Points labelled α, β, γ, δ and ε have details for elongation and P shown in Fig. 4α–ε. Zero time indicates the start of the low P and 13C exposure, as shown in Fig. 4. P was controlled by removing/restoring cell solution with a pressure probe. Each point represents four walls isolated, pooled and analysed as a single sample, with replicate samples shown.

