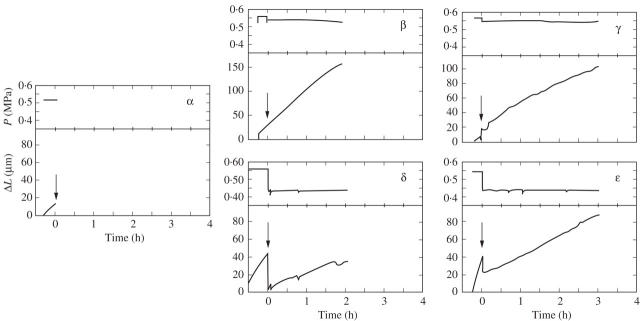
Fig. 4.
Details of P and change in length (ΔL) of cells contributing to data points α–ε in Fig. 3. (α) ΔL and P measured simultaneously in the same cell at the start of the treatment. 13C was supplied at the arrow, immediately after which the cell was harvested and the wall was isolated for analysis. (β) Same as (α) but exposed to 13C for 2 h before harvest. P decreased slightly at the arrow because of the osmotic effect of added 5 mm H13CO3. (γ) Same as (β) but exposed to 13C for 3 h. (Δ) Same as (β) but P was decreased 0.10 MPa with the pressure probe when 13C was added at the arrow. Note decreased dL/dt after P was stepped down. (ε) Same as (γ) except P was decreased 0.10 MPa with the pressure probe when 13C was added at the arrow. Each graph shows performance of one of the cells contributing to the pooled samples in Fig. 3. Similar results were obtained for the other three cells contributing to each pool.

