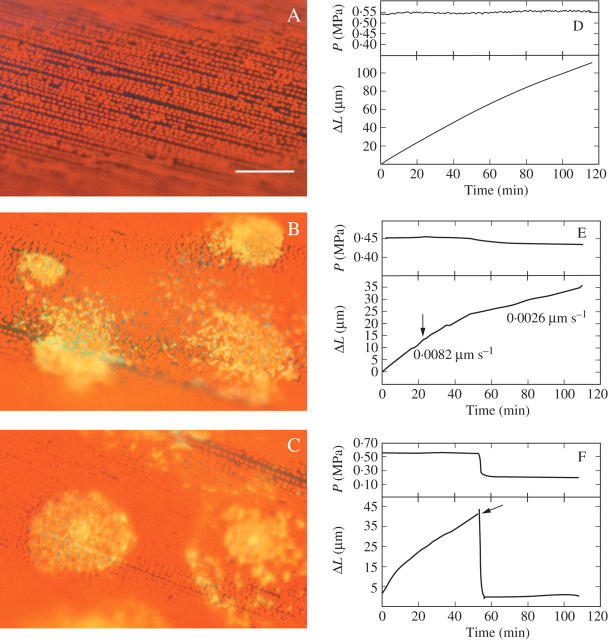
Fig. 6.
Effect of low P on chlortetracycline (CTC)-induced exocytosis in Chara internodes. (A) Autofluorescence and (D) P and change in length (ΔL) in a control cell with no CTC. Red autofluorescence is visible from the chloroplasts but no callose is present. (B) Autofluorescing callose deposits (yellow) are visible in a cell exposed to 0.25 mm CTC for 30 min and (E) P and elongation in an identically treated cell exposed to CTC at the arrow. Callose is being deposited in clumps at the inner face of the wall. Elongation rates are shown alongside the length trace. (C) Autofluorescing callose in cell exposed to 0.25 mm CTC plus 0.16 m (−0.4 MPa) mannitol for 30 min and (F) P and elongation in an identically treated cell exposed to CTC and low P at the arrow. Callose is being deposited at the inner face of the wall. Scale bar = 100 μm. See Table 1 for replicates.

