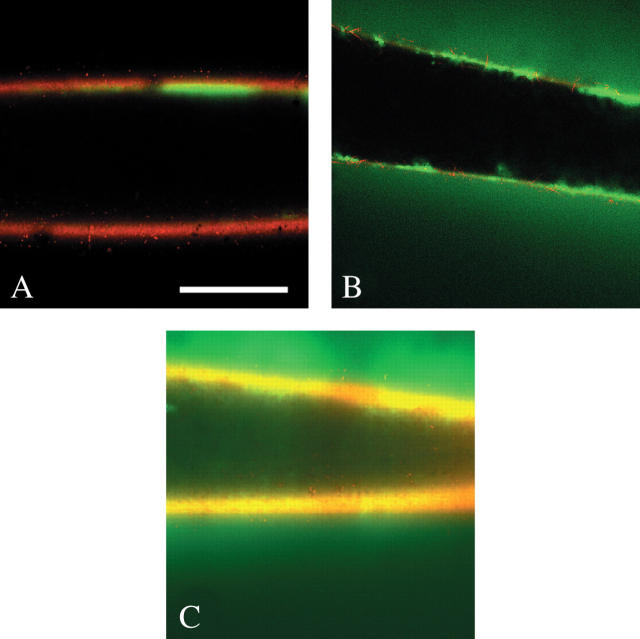
Fig. 8.
P-induced movement of dextran through Chara cell walls. (A) Low P of 0.05 MPa applied to oil in lumen (black inside the wall) for 25 min did not move 38-kDa FITC-dextran (green) through wall (red). FITC-dextran remained in lumen for 6 h. Scale bar = 0.5 mm. (B) Normal P of 0.5 MPa applied to oil in lumen for 3 min moved 38-kDa FITC-dextran into and through the wall, and into the unstirred culture medium outside. (C) Same as (B) but for 70-kDa FITC-dextran after P of 0.5 MPa for about 5 min. Movement through wall is apparent. At low P of 0.05 MPa or 0.25 MPa, however, no 70-kDa FITC-dextran moved through the wall (not shown, but appeared as in A). Walls were stained with Congo Red.

