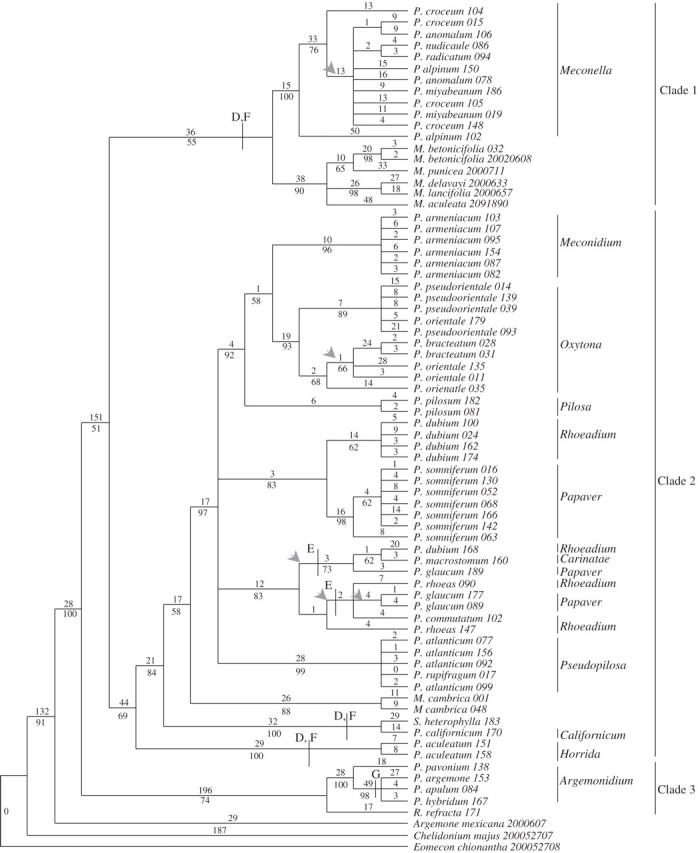
Fig. 2.

One of eight equally most-parsimonious trees generated from the trnL–F sequences using maximum parsimony. Support for each node is represented by bootstrap percentages (BP) below the branch (shown only when >50 % and consistent with the strict consensus tree). Numbers above each branch indicate the numbers of character changes along each lineage (ACCTRAN optimization). An arrow indicates branches that did not appear in the strict consensus tree. Groups that possess characteristic indels are indicated using letters (refer to Table 2).
