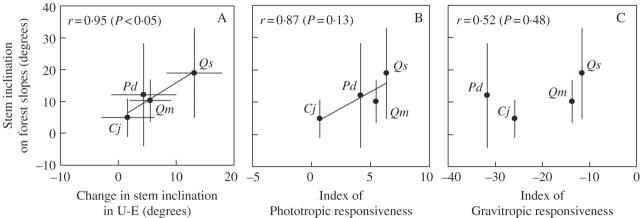
Fig. 7.
Relationship between the mean observed stem inclination on forest slopes and (A) the change in stem inclination in the U-E treatment, (B) the index of phototropic responsiveness (Rp) or (C) the index of gravitropic responsiveness (Rg). Species with a larger absolute value of Rp or Rg are more responsive. Error bars represent standard deviation. Pearson's correlation coefficient (r) and its P-value are shown for tests of the correlation in the population. Cj, Cryptomeria japonica; Pd, Pinus densiflora; Qm, Quercus myrsinaefolia; Qs, Q. serrata.

