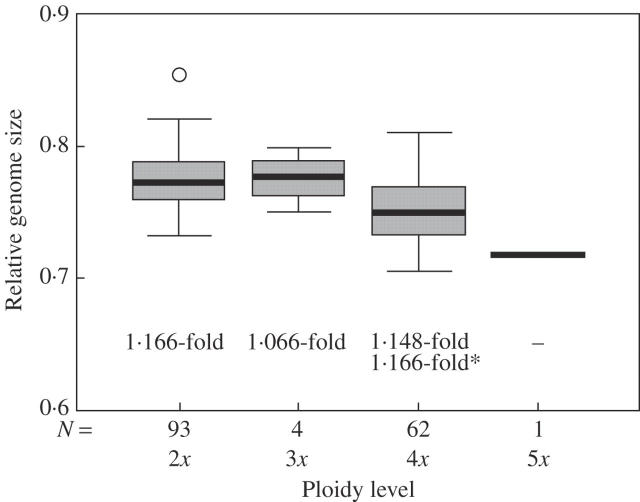
Fig. 5.
Relative genome size of separate ploidy levels of Festuca pallens. Relative genome size of higher polyploids (4x and 5x) is significantly smaller (t-test, P < 0·001). The numbers below the box plots give the total range of variation within the respective ploidy level. Relative genome size within all samples of all ploidy levels varied 1·201-fold. *Value calculated together with additional data from uncultivated population samples.

