
Fig. 8.
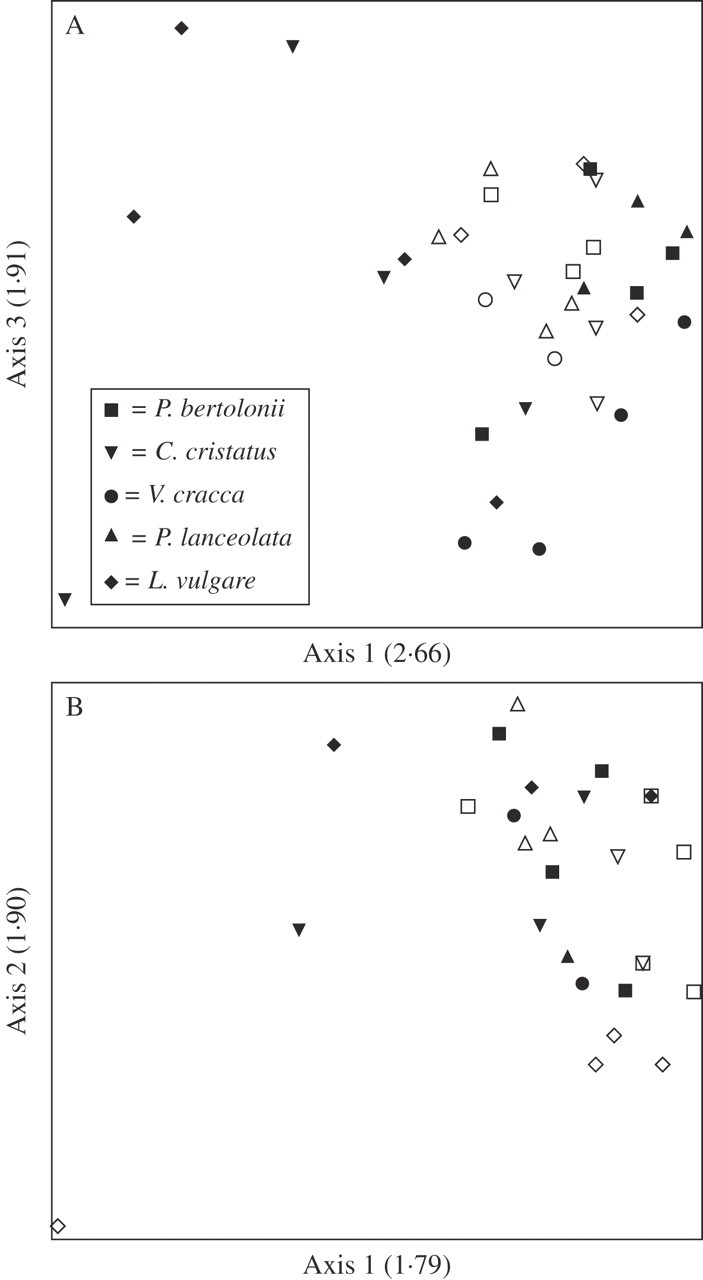
Principal component analysis plots of bands associated with (A) lignin and (B) suberin. Open symbols represent infected hosts and closed symbols represent uninfected hosts. Eigenvalues for each axis are given in parentheses.
Official websites use .gov
A
.gov website belongs to an official
government organization in the United States.
Secure .gov websites use HTTPS
A lock (
) or https:// means you've safely
connected to the .gov website. Share sensitive
information only on official, secure websites.
Principal component analysis plots of bands associated with (A) lignin and (B) suberin. Open symbols represent infected hosts and closed symbols represent uninfected hosts. Eigenvalues for each axis are given in parentheses.