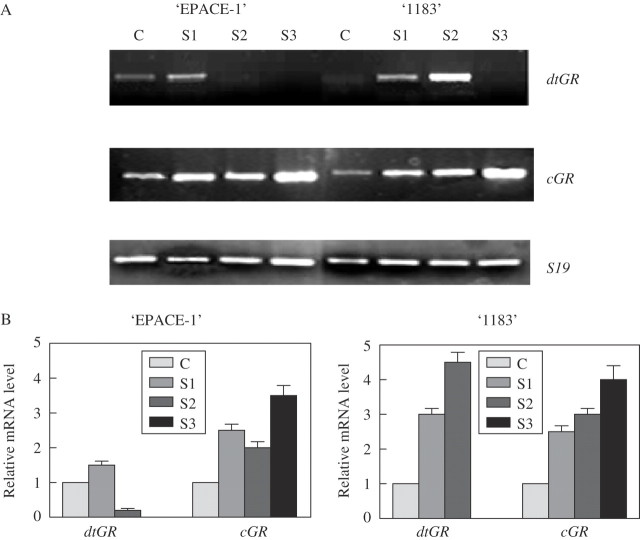
Fig. 3.
Effect of progressive drought on mRNA level of dtGR, cGR and S19 in ‘EPACE-1’ and ‘1183’ Vigna unguiculata leaves. Control plants (C), Ψw = −0·5 ± 0·1 MPa; S, droughted plants: S1, Ψw = −1·0 ± 0·1 MPa; S2, Ψw = −1·5 ± 0·2 MPa; S3, Ψw = −2·0 ± 0·2 MPa. (A) Gel analysis of GR isoenzyme transcripts; RT-PCR was carried out on 100 ng total RNA with 35 cycles, results were visualized using a UV light transilluminator. (B) Relative mRNA level. The mRNA levels were quantified with the Imager 1D/2D software and normalized to the respective S19 gene. Relative transcript levels were calculated with reference to the controls taken as 1 (100 %). Results are means ± s.d. of three independent experiments.

