
Figure 1. SUMO putative targets in C. elegans.
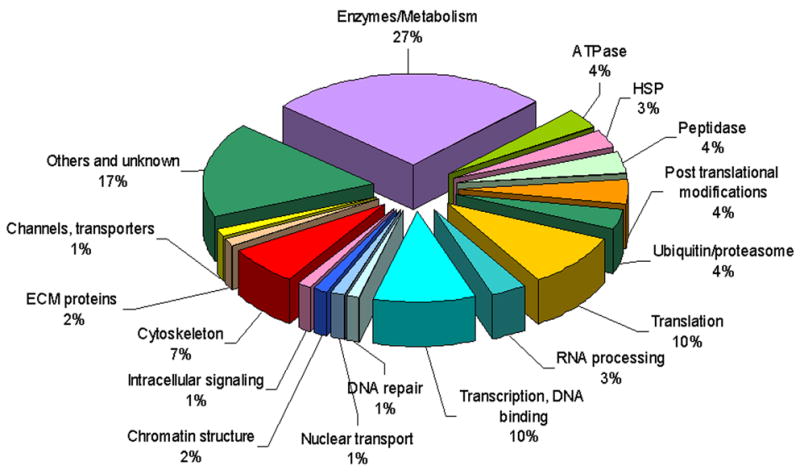
The identified SUMO putative targets are arranged in functional groups according to their relative abundance. Nuclear targets are labeled with blue colors. Cytoskeleton targets are labeled in red. The entire list of candidates is presented in Table S1. See also Figure S1.