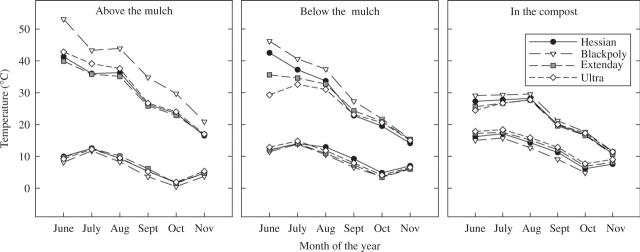
Fig. 2.
The hourly mean average maximum and minimum temperatures for each month recorded throughout the growing season at three positions within the strawberry crop: air temperature above the mulch surface (5 cm); air temperature directly below the mulch on top of the compost; and soil temperature within the compost (at depth of 5 cm). Each data point represents data from three temperature sensors in three different experimental blocks. Data from both ‘Elsanta’ and ‘Flamenco’ are combined as there were no obvious cultivar differences.

