
Fig. 2.
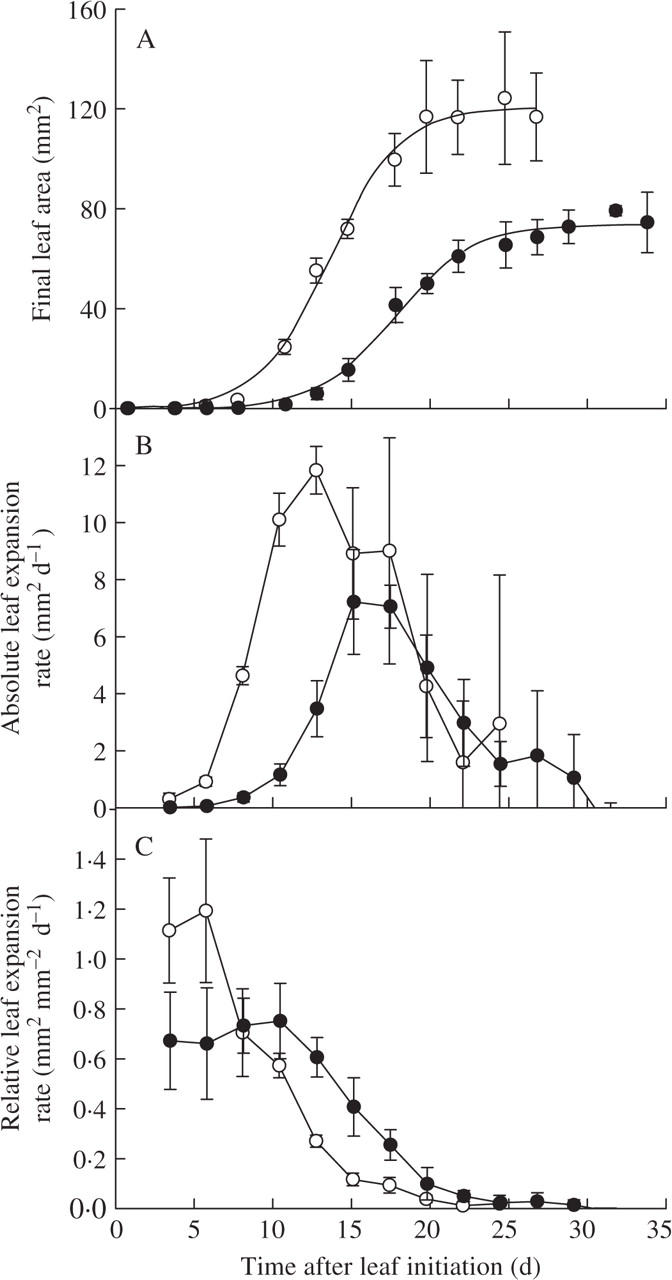
Changes with time of (A) leaf 6 area, (B) absolute leaf 6 expansion rate, and (C) relative leaf 6 expansion rate of plants grown under light (8·4 mol m−2 d−1, open symbols) or shade treatment (2·5 mol m−2 d−1, closed symbols) in expt 3. Means with 95 % intervals of confidence are given, each point represents the measurement of five leaf areas.