
Fig. 3.
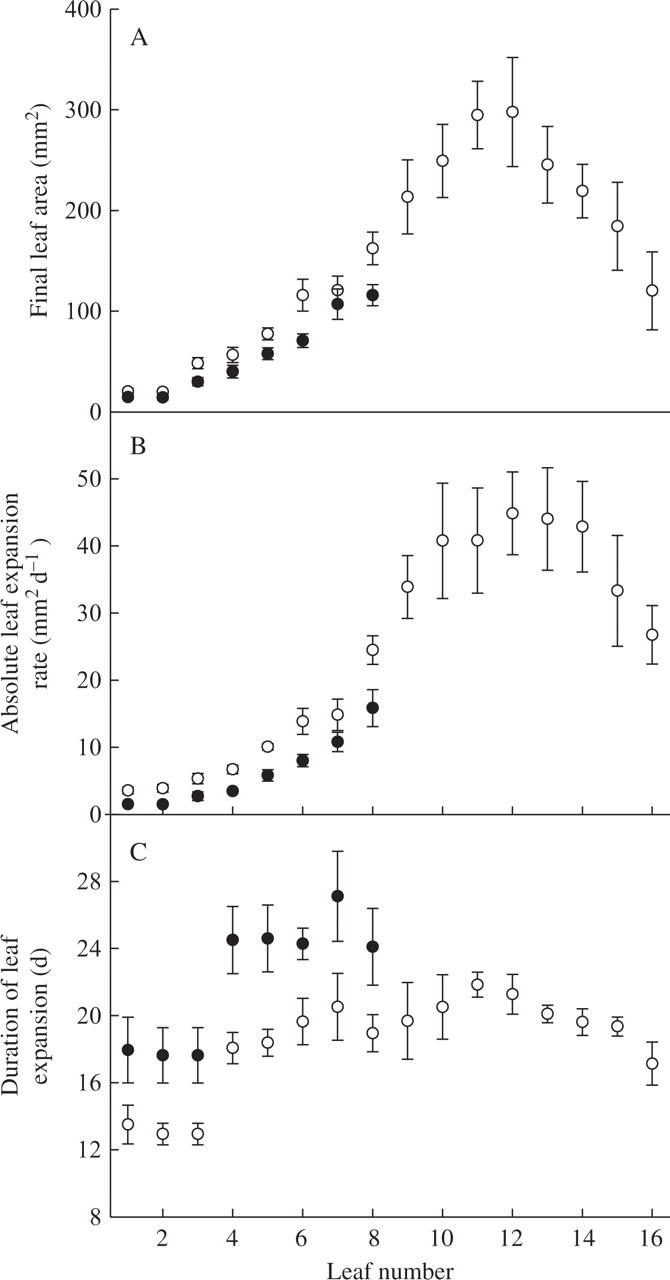
The profiles of (A) final leaf area, (B) maximum absolute leaf expansion rate and (C) the duration of leaf expansion of each leaf of plants grown under light (9·4 mol m−2 d−1, open symbols) or shade treatment (2·7 mol m−2 d−1, closed symbols) in expt 1. Means with 95 % intervals of confidence are given (n = 10).