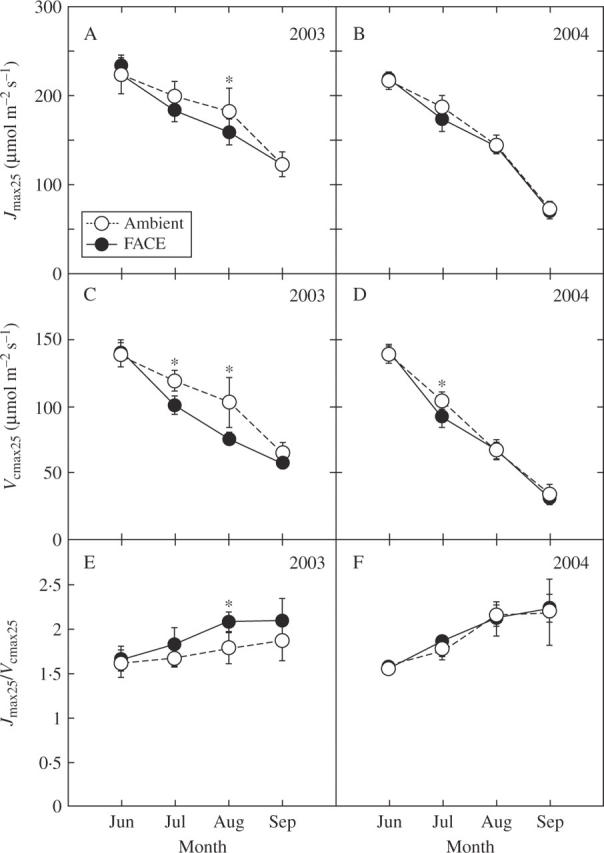
Fig. 2.

Seasonal change in (A, B) the maximum rate of electron transport (Jmax25), (C, D) the maximum rate of caboxylation (Vcmax25), and (E, F) the Jmax25/Vcmax25 ratio at 25 °C for rice (Oryza sativa) grown at ambient CO2 (370 µmol mol−1, open symbols) and at elevated CO2 (570 µmol mol−1, closed symbols) in 2003 (A, C, E) and 2004 (B, D, F). Data from two plots are pooled and shown as mean ± s.e. (n = 6). Asterisks indicate significant differences between CO2 treatments at P < 0·05.
