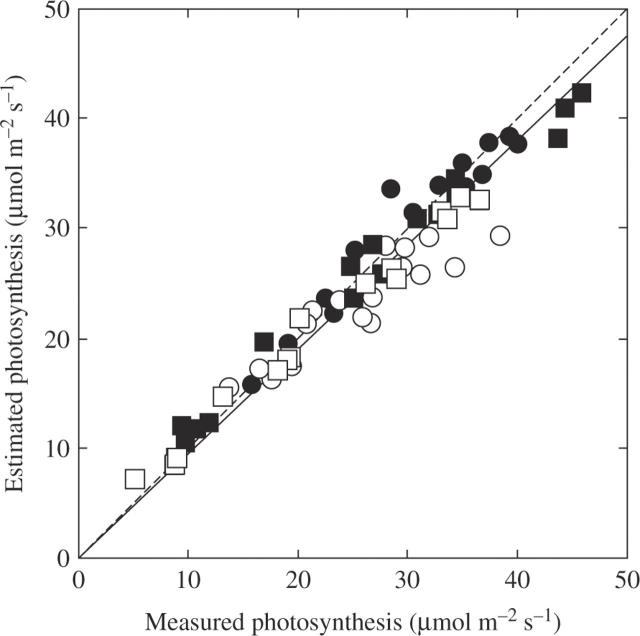
Fig. 5.
Comparison between measured and estimated photosynthesis of plants grown at ambient CO2 (370 µmol mol−1, open symbols) and at elevated CO2 (570 µmol mol−1, closed symbols) in 2003 (circles) and 2004 (squares). The solid line is the regression y = 0·95x (r = 0·97, P < 0·0001). The broken line indicates equivalence between measured and estimated photosynthesis.

