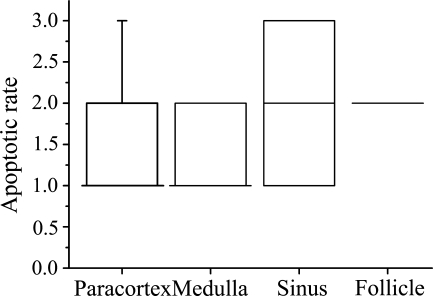
Figure 3.
Box plot chart showing the density score of TUNEL-positive cells in different anatomical compartments of human reactive lymph nodes. Numerical density was based on different double stainings combining TUNEL with either Fas, FasL, or cell lineage markers CD3 or CD20. The number of TUNEL-positive cells in a high-power field (100× objective) including both single and double positives was calculated in each area and converted to a density score (1–3). Box plots include median, quartiles, 5–95% interval. See Materials and Methods for details.

