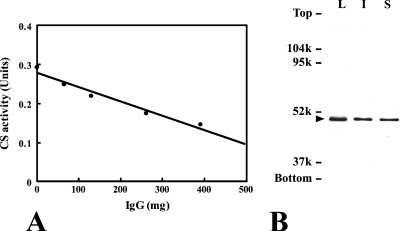
Figure 1.
Titration of citrate synthase (CS) with the antibody (A). Immunoblot analysis of the rat liver (L) with 4 μg of protein, the interstitial tissue (I) with 1 μg of protein, and seminiferous tubules (S) with 1 μg of protein (B). Note the single bands (arrowhead) in three types of homogenates at the same mobility.

