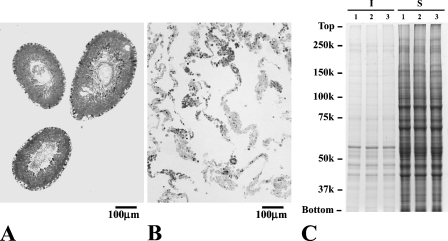
Figure 4.
Analysis of the separation of testicular tissues. Light micrographs of the seminiferous tubules (A) and the interstitial tissue (B), and electrophorogram of their polypeptides (C). Three samples prepared separately from three animals were subjected to electrophoresis with 10 μg of protein for interstitial tissues (I), and with 80 μg of protein for seminiferous tubules (S). The positions of the standard proteins are indicated. Note that the separated interstitial tissue is devoid of seminiferous tubules, and vice versa, and that seminiferous tubules and interstitial tissues show quite different polypeptide profiles.

