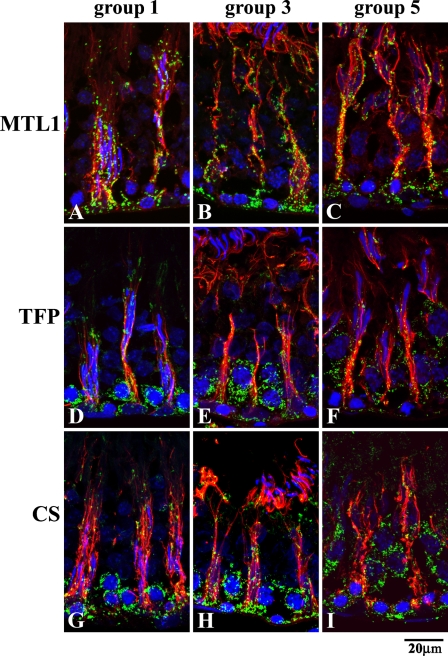
Figure 7.
Immunofluorescent micrographs of seminiferous tubules observed at high-power magnification, stained for mitochondrial fatty acid β-oxidation enzymes, MTL1 (A–C) and TFP (D–F), and CS (G–I) as a marker for mitochondria (green), tyrosinated α-tubulin (red) as a marker for Sertoli cells, and 4′,6-diamino-2-phenylindole for nuclear staining, at various stages expressed as three groups (1, 3, and 5), to show the difference in the localization of enzymes among the stages. Note that the staining patterns are the same among all the groups.

